Customer training ROI isn’t measured by what gets completed.
It’s measured by what stops happening.
Support tickets that don’t get filed. Features that get adopted instead of ignored. Customers who don’t churn because they finally understood how to succeed.
Most companies track the wrong metrics. They celebrate course completion rates while support volume climbs. They measure engagement while adoption stalls. They report training hours while customers quietly churn.
The metrics that matter aren’t activity metrics. They’re outcome metrics.
Completion doesn’t mean comprehension. Enrollment doesn’t mean usage. Time spent doesn’t mean value extracted. A customer can finish every training module and still fail to reach their desired outcome.
When training is measured by the wrong things, investment decisions follow the wrong logic. Budgets get allocated to content creation when the real problem is content findability. Resources go toward building more courses when customers are abandoning the ones that already exist.
This guide covers the metrics that actually correlate with business outcomes: lower churn, reduced support costs, higher product adoption, and expanded revenue. These aren’t vanity metrics. They’re the numbers that justify continued investment — or reveal when training isn’t working at all.
Why Traditional Training Metrics Mislead
Before understanding what to measure, it’s critical to understand why most training metrics fail to predict business outcomes.
The Completion Rate Illusion
Course completion rates are the most commonly tracked training metric. They’re also among the least useful.
A 90% completion rate sounds impressive. But it reveals nothing about whether customers actually learned what they needed, whether they applied that knowledge, or whether training influenced their decision to stay or leave.
Completion measures compliance, not capability. It answers “Did they finish?” not “Did it work?”
High completion rates can coexist with rising support ticket volume, low feature adoption, and increasing churn among “trained” customers. The metric doesn’t predict the outcome.
The Engagement Trap
Engagement metrics — time spent, modules accessed, videos watched — suffer from the same problem. They measure activity, not impact.
A customer who spends 45 minutes watching onboarding videos isn’t necessarily more successful than a customer who spends 5 minutes finding one critical answer. The former might be confused and struggling. The latter might be competent and efficient.
Without connecting engagement to outcomes, the metric is noise.
The Five Metrics That Actually Matter
Effective customer training ROI measurement starts with outcomes, not activities.
1. Support Ticket Deflection
What It Measures: The reduction in support tickets about topics covered in training.
Why It Matters: Support ticket deflection is one of the most direct ROI signals. For most B2B SaaS companies, support teams spend 40-60% of their time answering repetitive “how do I” questions that training should prevent.
How to Measure It:
- Baseline ticket volume by topic before training launches (30-60 days)
- Track post-training volume for the same categories (30-60 days after training)
- Calculate deflection rate:
Deflection Rate = (Baseline Tickets – Post-Training Tickets) / Baseline Tickets × 100
Example:
- Baseline: 80 tickets/month about “SSO setup”
- Post-training: 52 tickets/month
- Deflection rate: (80 – 52) / 80 = 35% reduction
What Good Looks Like:
- Strong: 25-40% reduction within 60 days
- Moderate: 15-25% reduction
- Weak: <10% reduction (training isn’t working)
ROI Calculation:
Annual Savings = (Deflected Tickets × Avg Resolution Time × Hourly Cost) × 12
Example:
- 28 tickets/month deflected
- 30 minutes avg resolution time
- $40/hour fully loaded cost
Annual Savings = (28 × 0.5 × $40) × 12 = $6,720/year
For a $500/month training platform, this pays for itself through support savings alone.
2. Time-to-Value (Activation Speed)
What It Measures: Days from signup to first meaningful product usage.
Why It Matters: Time-to-value is one of the strongest predictors of long-term retention. Customers who reach value quickly are 3-5× more likely to remain customers after 90 days.
When training accelerates activation, it directly reduces early churn — the most expensive type because CAC hasn’t been recovered yet.
How to Measure It:
- Define your activation milestone (first dashboard created, first workflow completed, first API call)
- Track days-to-milestone for trained vs. untrained cohorts
- Compare median time-to-value:
Improvement = (Control Median – Training Median) / Control Median × 100
Example:
- Control group: 12 days to first project created
- Training group: 5 days to first project created
- Improvement: 58% faster activation
What Good Looks Like:
- Strong: 40-60% faster
- Moderate: 20-40% faster
- Weak: <15% difference
Why This Predicts Churn:
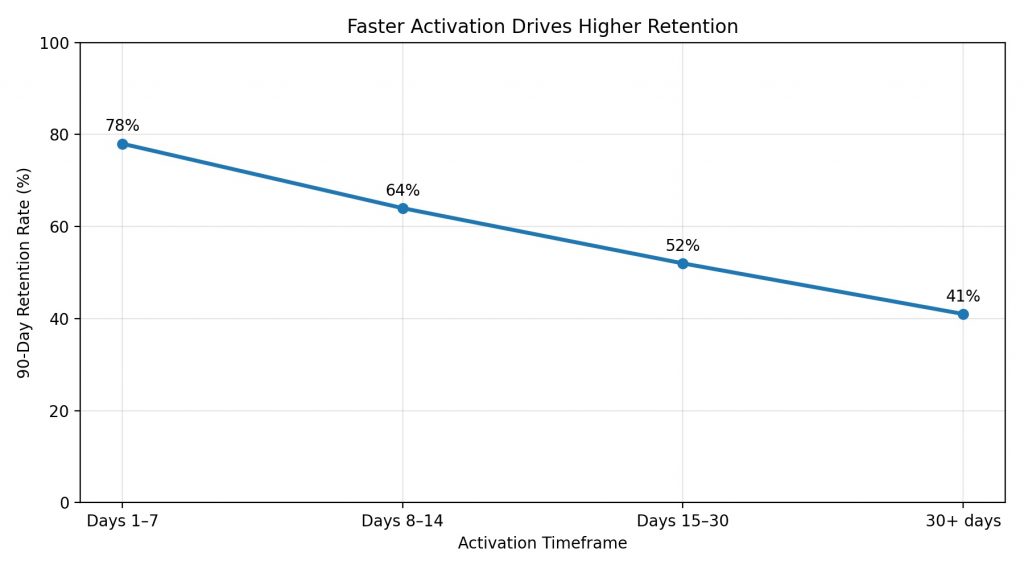
Customers who activate within 7 days show 78% retention at 90 days, compared to 41% for those taking 30+ days. Training that moves customers into faster activation buckets materially impacts retention.
3. Feature Adoption Rate
What It Measures: The percentage of customers using features covered in training compared to those who didn’t receive training.
Why It Matters: Feature adoption directly correlates with retention (customers using 3+ features churn 40-60% less), expansion revenue (advanced feature users upgrade more), and product stickiness.
How to Measure It:
- Track feature usage by training status (trained vs. untrained)
- Calculate adoption lift:
Adoption Lift = (Trained Usage – Untrained Usage) / Untrained Usage × 100
Example:
- Trained customers: 42% use advanced reporting within 60 days
- Untrained customers: 18% use it
- Adoption lift: (42 – 18) / 18 = 133% increase
What Good Looks Like:
- Strong: 80-150% lift
- Moderate: 40-80% lift
- Weak: <25% lift
Feature-Specific Analysis:
Not all features benefit equally from training. Focus on high-complexity features where untrained adoption is <20% — these see the highest training impact.
ROI Calculation:
Expansion Revenue = (Additional Adopters × Upgrade Rate × Expansion ARPU)
Example:
- 500 customers trained on advanced features
- Training increases adoption by 20 percentage points. In other words, 100 customers started using the feature who wouldn’t have otherwise.
- 40% of these adopters upgrade
- Expansion ARPU: $200/month
Monthly expansion = 40 × $200 = $8,000/month ($96,000/year)
Feature adoption training pays for itself through expansion revenue, not just retention.
4. Customer Health Score Improvement
What It Measures: Change in customer health scores for trained vs. untrained cohorts.
Why It Matters: Health scores predict churn before it happens. Customers with declining health scores are 5-10× more likely to churn within 90 days. If training improves health scores, it’s preventing churn proactively.
How to Measure It:
- Baseline health scores 30 days before training
- Measure post-training (30-60 days after)
- Compare to untrained control:
Health Score Lift = Trained Improvement – Control Improvement
Example:
- Trained cohort: +12 points (65 → 77)
- Control cohort: +3 points (64 → 67)
- Attributable lift: +9 points
What Good Looks Like:
- Strong: +8-15 point lift
- Moderate: +4-8 points
- Weak: <3 points
Which Components Improve Most:
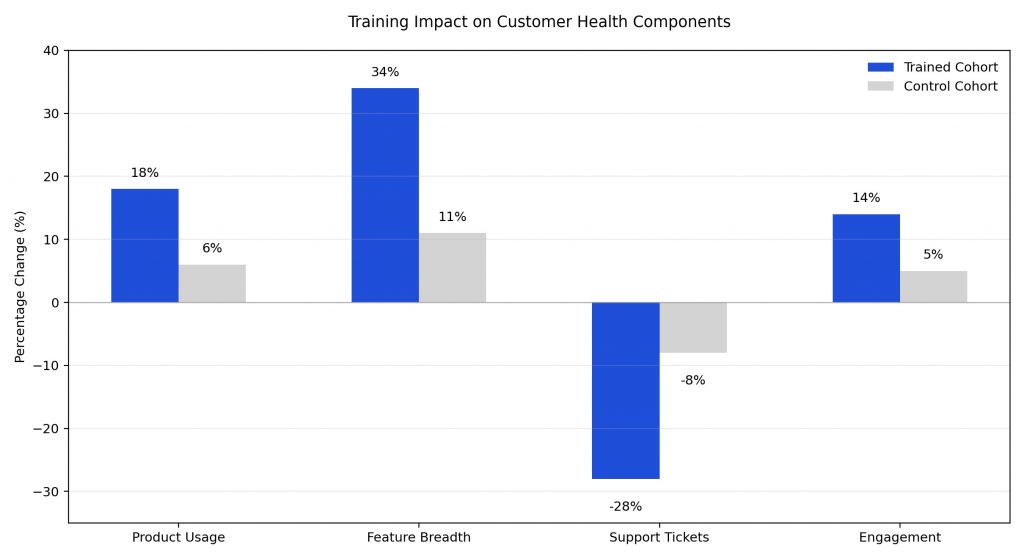
Training’s biggest impact typically shows in feature breadth (+34% vs. +11% control) and support ticket reduction (-28% vs. -8% control) — exactly what predicts retention.
5. Cost Per Trained Customer
What It Measures: Total cost of delivering training divided by customers who complete it, including platform cost, content creation, maintenance, and support/CSM time.
Why It Matters: Cost per trained customer reveals scalability. Effective platforms reduce this cost over time as fixed platform costs spread across a growing customer base and self-service reduces CSM time.
How to Calculate:
Cost Per Customer = (Platform + Content Creation + Maintenance + CSM Time) / Trained Customers
Example (Month 1 vs. Month 6):
Month 1:
- Platform: $800
- Content creation: $3,000 (one-time)
- Maintenance: $375
- CSM time: $900
- Total: $5,075 / 85 customers = $59.71 per customer
Month 6:
- Platform: $800
- Content creation: $0
- Maintenance: $375
- CSM time: $480 (self-service improving)
- Total: $1,655 / 142 customers = $11.65 per customer
80% cost reduction as content scales and CSM dependency drops.
What Good Looks Like:
- Strong: 50-70% decrease from Month 1 to Month 6
- Moderate: 30-50% decrease
- Weak: Flat or increasing (not scaling)
Benchmark Targets by Scale:
- 50-100 customers: $30-60
- 100-300 customers: $15-35
- 300-1,000 customers: $8-20
- 1,000+ customers: $5-12
The Complete ROI Model
Individual metrics matter. But ROI becomes clear when metrics combine to show total business impact.
The Formula:
Annual ROI =
(Support Hours Saved × Cost)
+ (Churn Reduction × Customer LTV)
+ (Expansion Revenue)
– (Platform + Content + Maintenance)
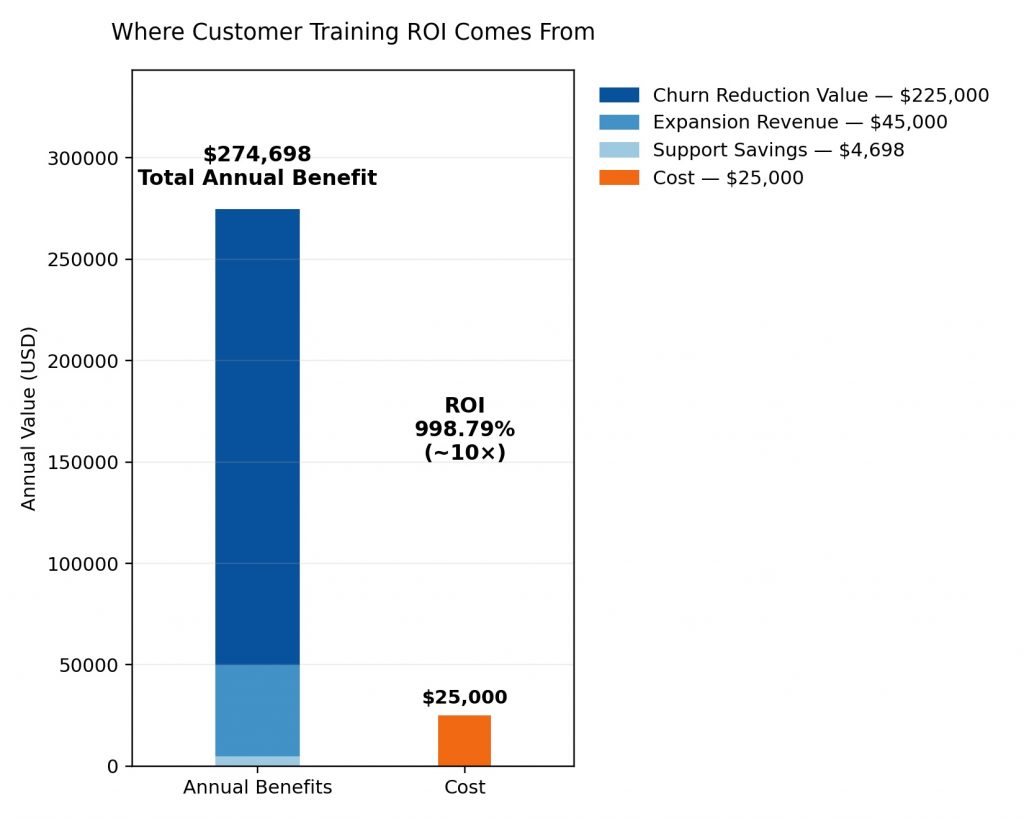
Example: B2B SaaS Company (300 Customers)
Inputs:
- Customer LTV: $75,000
- Support hourly cost: $45
- Training platform: $10,000/year
- Content: $15,000/year (Year 1)
Measured Training Impact:
- Support deflection: 30% = 180 tickets/year
- Ticket time: 35 minutes
- Churn reduction: 2 percentage points (42% → 40%)
- Expansion: 15 upgrades/year at $250/month
ROI Calculation:
Support savings: 180 × 0.58 hrs × $45 = $4,698/year
Churn reduction: 300 × 0.02 = 6 customers saved
6 × $75,000 = $450,000 lifetime value
Year 1 impact: $225,000
Expansion: 15 × $250 × 12 = $45,000/year
Total benefit: $274,698
Total cost: $25,000
ROI: 998.79%
Even when Churn reduction is kept at a measly 2%, it leads to a 10x ROI.
When Metrics Reveal Training Isn’t Working
Not all training delivers ROI. Metrics reveal when investment should stop — or change direction.
Warning Sign 1: High completion, low impact
- 85% completion but support tickets unchanged and feature adoption flat
Diagnosis: Content teaches but doesn’t enable. Customers finish without gaining capability.
Fix: Break courses into task-based modules focused on “how to solve X” not “overview of Y.”
Warning Sign 2: Good early metrics, declining over time
- Month 1: 40% deflection → Month 6: 18% deflection
Diagnosis: Content decaying. Product changes but training doesn’t keep pace.
Fix: Implement maintenance schedule. Modular content ages more gracefully than full courses.
Warning Sign 3: High cost per customer, flat or rising
- Month 1: $45 → Month 6: $52
Diagnosis: Training isn’t scaling. CSM time preventing self-service.
Fix: Move to search-first, on-demand model. Reduce scheduled sessions.
What Modern Platforms Measure Differently
Traditional LMS platforms report completions and time spent. Modern customer training platforms measure outcomes.
Traditional Dashboard:
- 847 learners enrolled
- 623 courses completed (74%)
- 1,247 hours consumed
- 89% satisfaction score
Missing: Did any of this reduce churn, lower support costs, or drive adoption?
Modern Dashboard:
- 35% reduction in support tickets (trained topics)
- 12 days → 5 days median time-to-value
- 127% feature adoption lift
- $8,200/month expansion revenue from training
- $14.20 cost per customer (down from $41.80)
What’s different: Every metric connects to a business outcome.
Modern platforms track what customers search for but don’t find (content gaps), where they abandon training (exact timestamps), which training correlates with feature usage, and whether trained topics still generate support tickets.
These insights don’t just report what happened. They reveal what to fix. See how advanced analytics capabilities connect training to business outcomes →
The Long Game: ROI That Compounds
Customer training ROI isn’t linear. It compounds.
Month 3: Training reduces support by 25%. Saves $2,000/month.
Month 6: Month 3 customers are now power users, advocating internally. Expansion increases. Trained customers churn 12% less.
Month 12: Customers from Months 1-6 renew at higher rates. CAC payback shortens. NRR improves.
Month 18: When product adds features, trained customers adopt 3× faster than untrained.
The value isn’t just “ticket deflection this quarter.” It’s faster activation + higher adoption + lower churn + expansion revenue + faster new feature uptake — compounding over customer lifetime.
This is why customer training is an investment, not an expense. And why measuring outcomes, not activities, reveals whether that investment pays off.
For a comprehensive approach to customer training strategy and measurement frameworks, see our complete customer training LMS guide. These ROI principles work best within a broader implementation strategy that addresses why traditional training approaches fail structurally.
Beetsol’s Approach to Training ROI
Beetsol tracks the metrics that matter: support deflection, adoption correlation, and search gaps that reveal where training fails.
Instead of celebrating course completions, Beetsol shows what customers search for but can’t find (content gaps causing support escalation), which training correlates with feature adoption (what drives behavior), where customers drop off (exact moments to fix), and how trained vs. untrained customers differ in health scores and retention.
The result: training that justifies itself through measurable business outcomes, not activity reports.
See how Beetsol measures customer training impact →
FAQ
How do we measure customer training ROI?
Track outcome metrics, not activity metrics. The most important: (1) Support ticket deflection by topic, (2) Time-to-value improvement, (3) Feature adoption lift for trained vs. untrained customers, (4) Churn rate difference between cohorts, and (5) Cost per trained customer over time. These connect training to business outcomes.
What’s a good support ticket deflection rate?
Strong performance is 25-40% reduction in topic-specific tickets within 60-90 days of training launch. Below 15% suggests training isn’t effectively addressing customer questions or isn’t findable when needed.
How long before customer training ROI becomes measurable?
Support deflection shows within 30-60 days. Time-to-value improvements appear within 60-90 days. Feature adoption and churn impacts require 90-180 days of data. Full ROI picture emerges around Month 6, but early signals appear much sooner.
Why do course completion rates not predict customer success?
Completion measures compliance, not capability. A customer can finish all training and still lack the knowledge to succeed if content doesn’t match their actual questions, or if they can’t find the right training at the moment of need. Outcome metrics (adoption, retention, support deflection) reveal whether training actually worked.
How much should customer training cost per customer?
Target cost per trained customer varies by scale: $30-60 for 50-100 customers, $15-35 for 100-300 customers, $8-20 for 300-1,000 customers, and $5-12 for 1,000+ customers. Cost should decrease significantly over 6-12 months as content scales and CSM time reduces.
